pacman::p_load(corrplot,ggstatsplot,tidyverse)In-class Exercise 5
Install and launching R packages
Importing Data
wine <- read_delim("data/wine_quality.csv")Building a basic correlation matrix
pairs(wine[,1:11])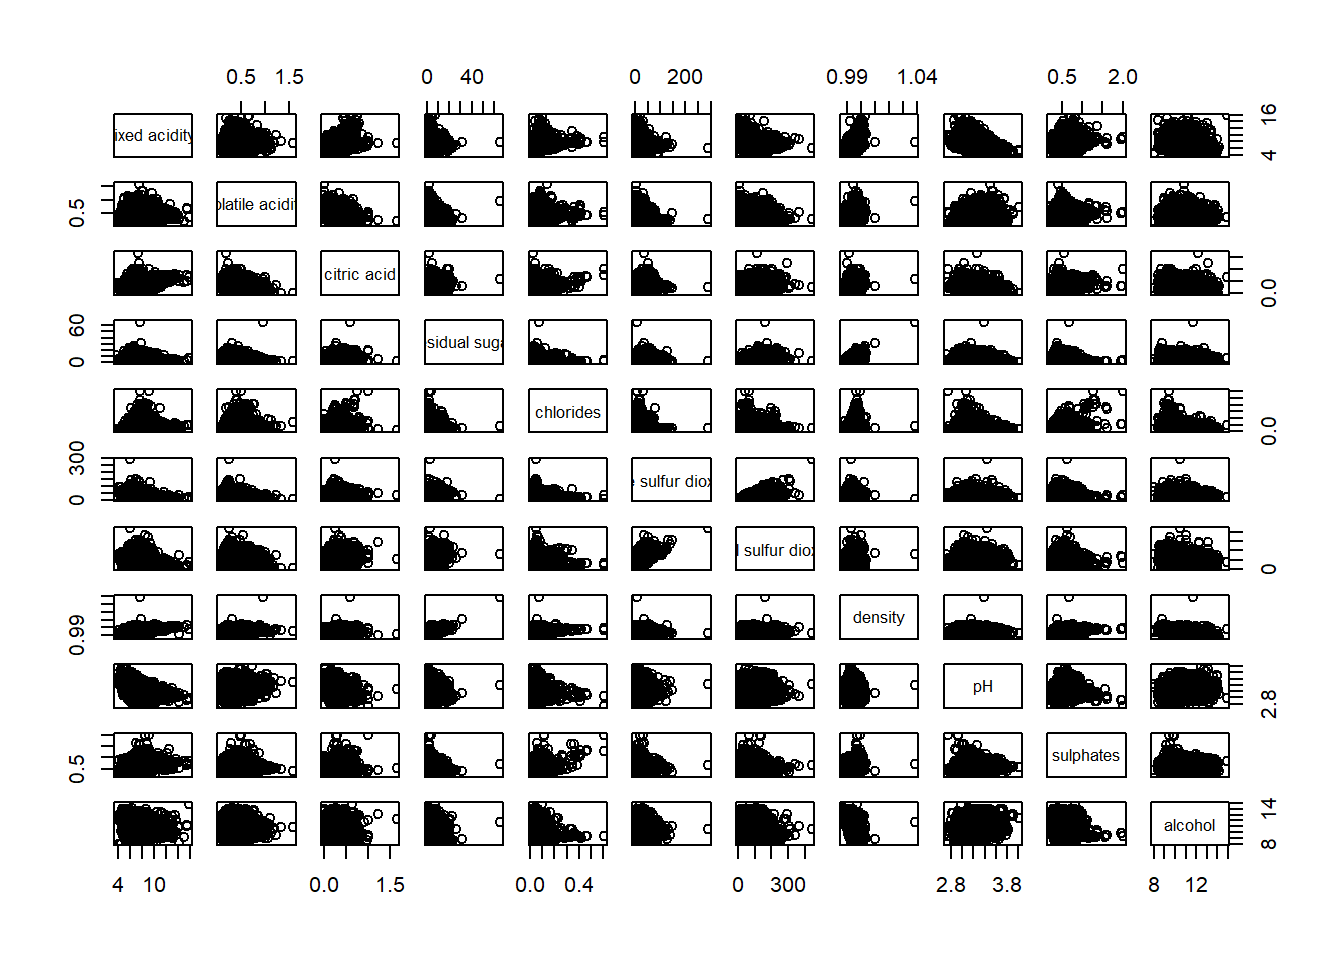
pairs(wine[,2:12])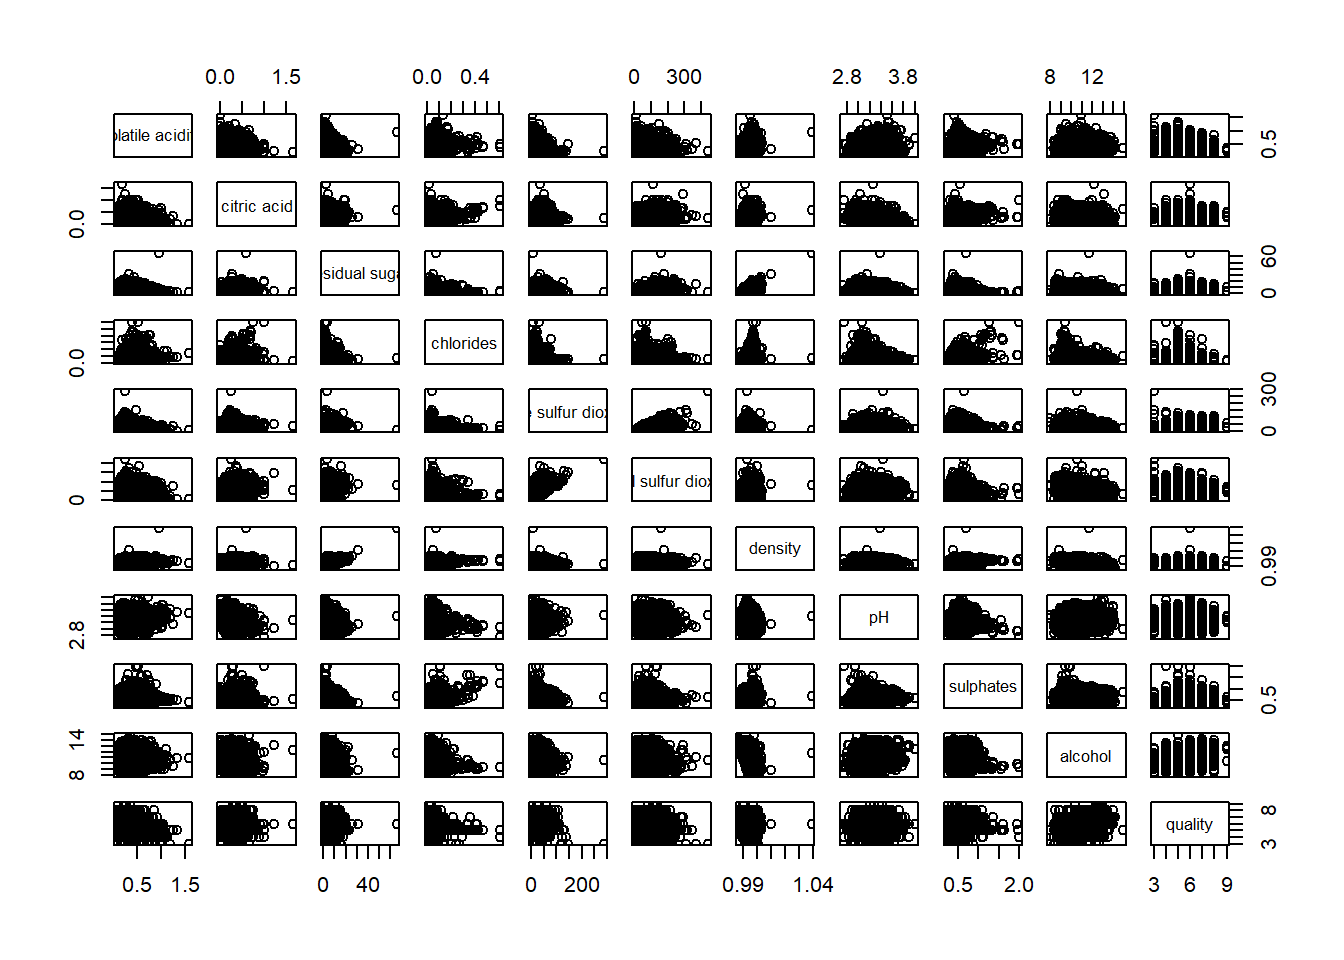
Drawing the lower corner
pairs(wine[,2:12], upper.panel = NULL)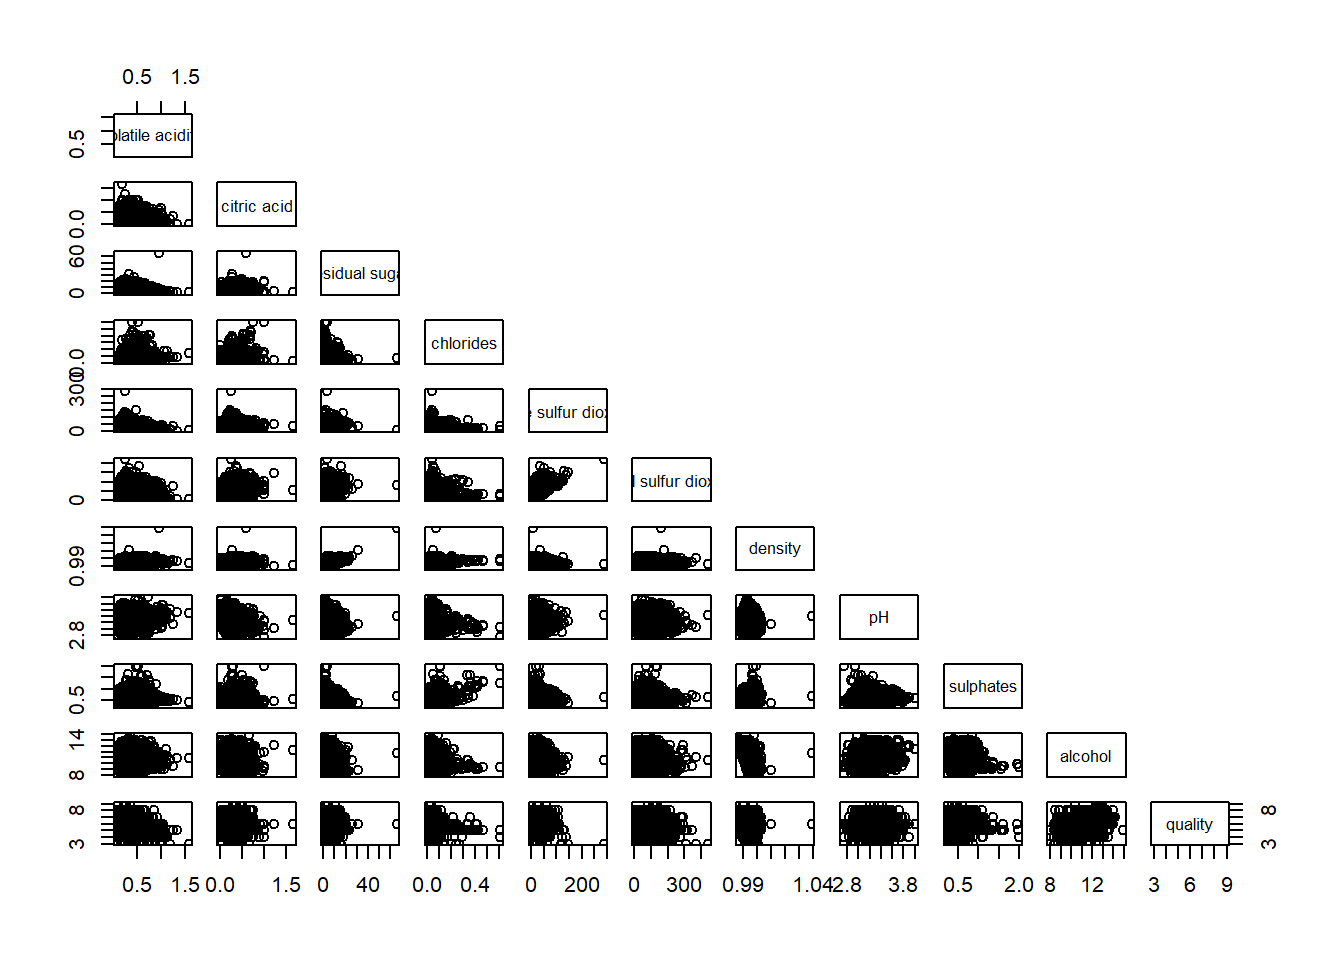
pairs(wine[,2:12], lower.panel = NULL)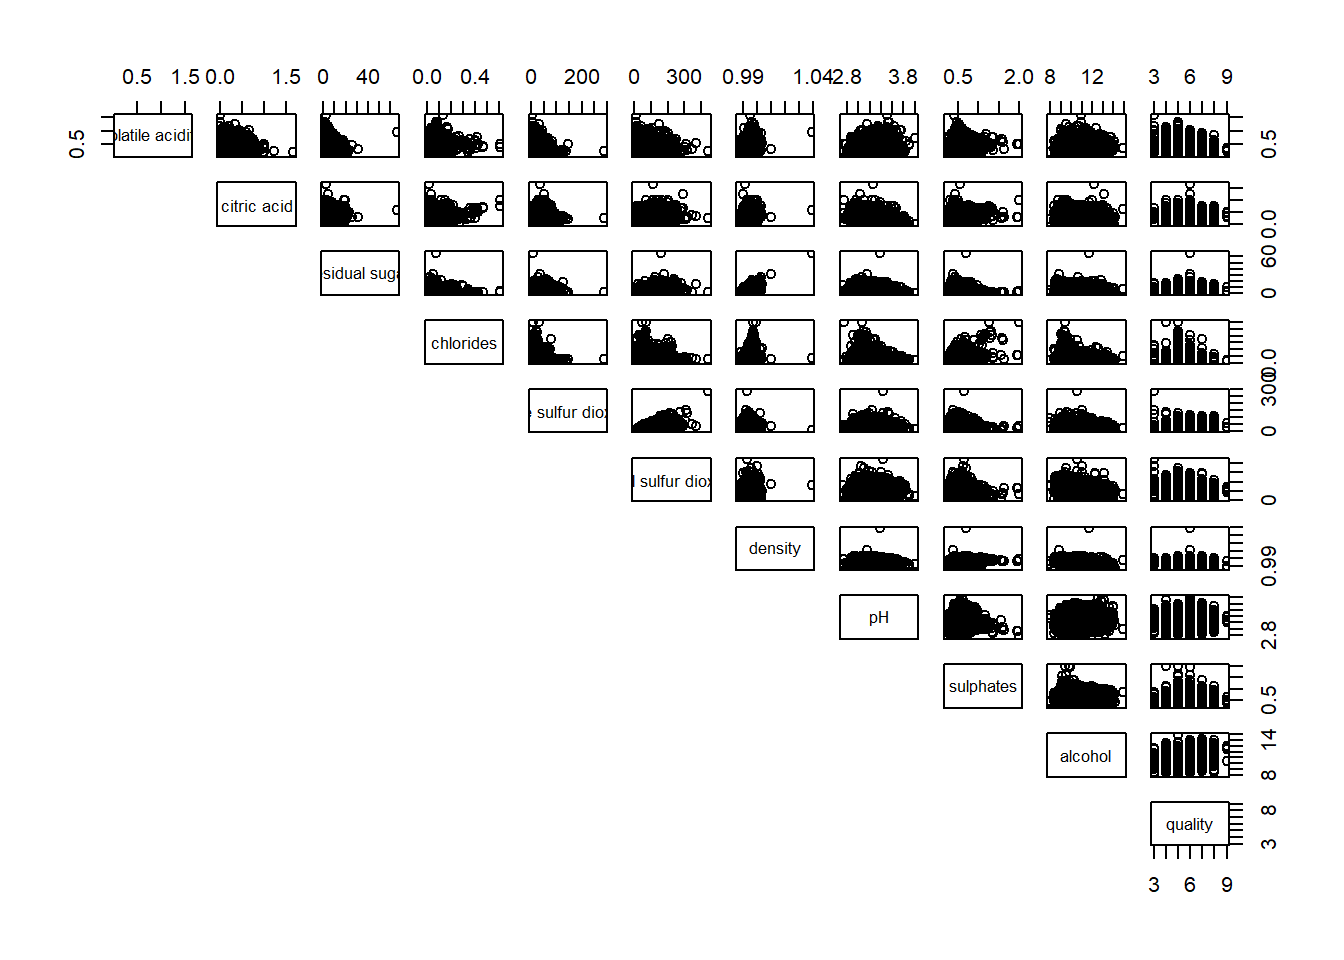
The basic plot
ggstatsplot::ggcorrmat(data = wine, cor.vars = 1:11)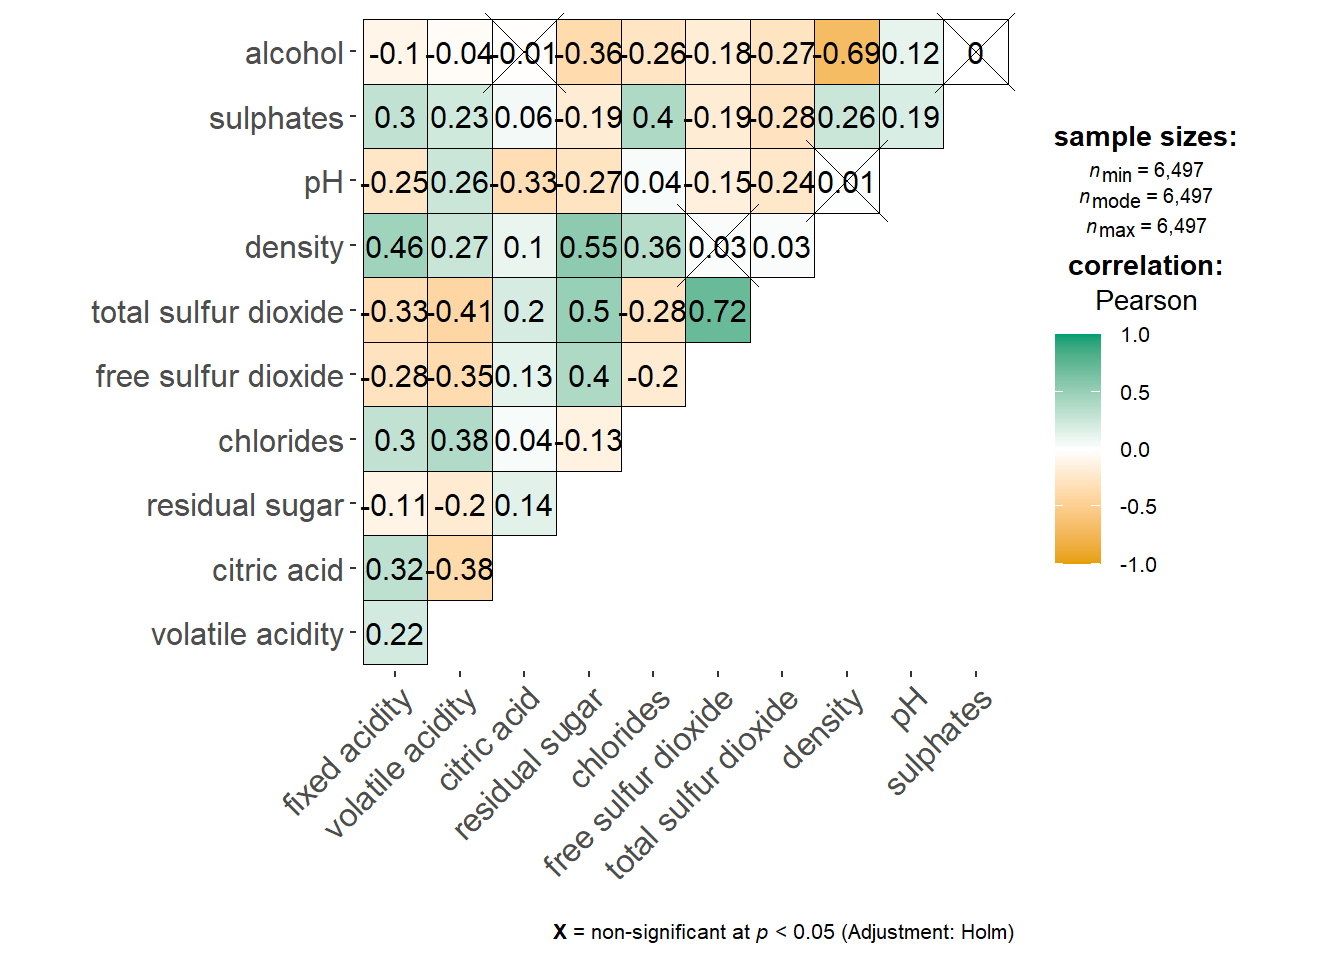
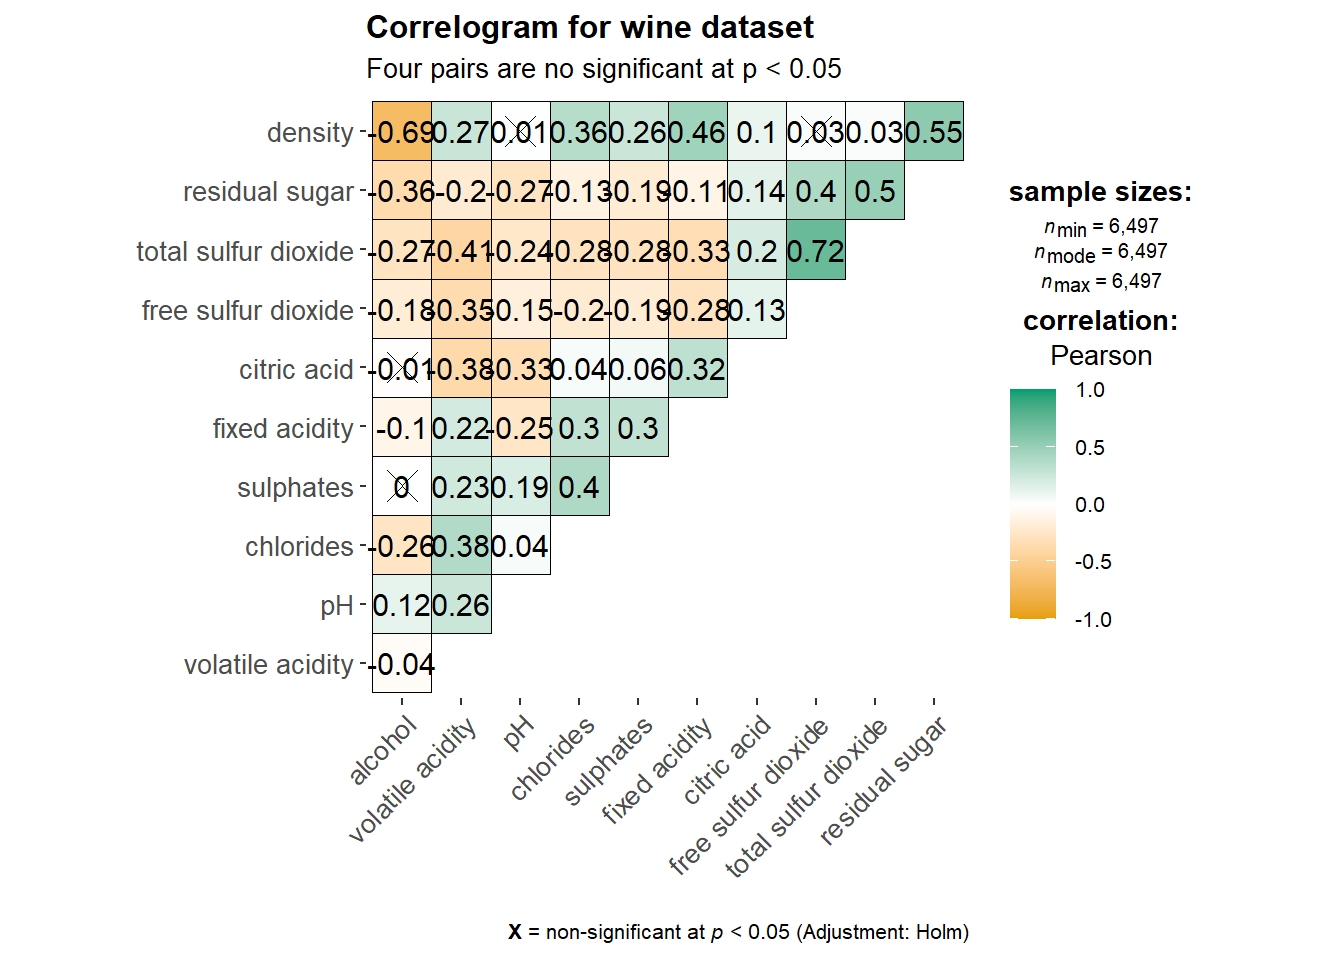
ggstatsplot::ggcorrmat(
  data = wine,
  cor.vars = 1:11,
  ggcorrplot.args = list(outline.color = "black",
                         hc.order = TRUE,
                         tl.cex = 10),
  title    = "Correlogram for wine dataset",
  subtitle = "Four pairs are no significant at p < 0.05"
)
Getting started with corrplot
wine.cor <- cor(wine[,1:11],use="pairwise.complete.obs")corrplot(wine.cor)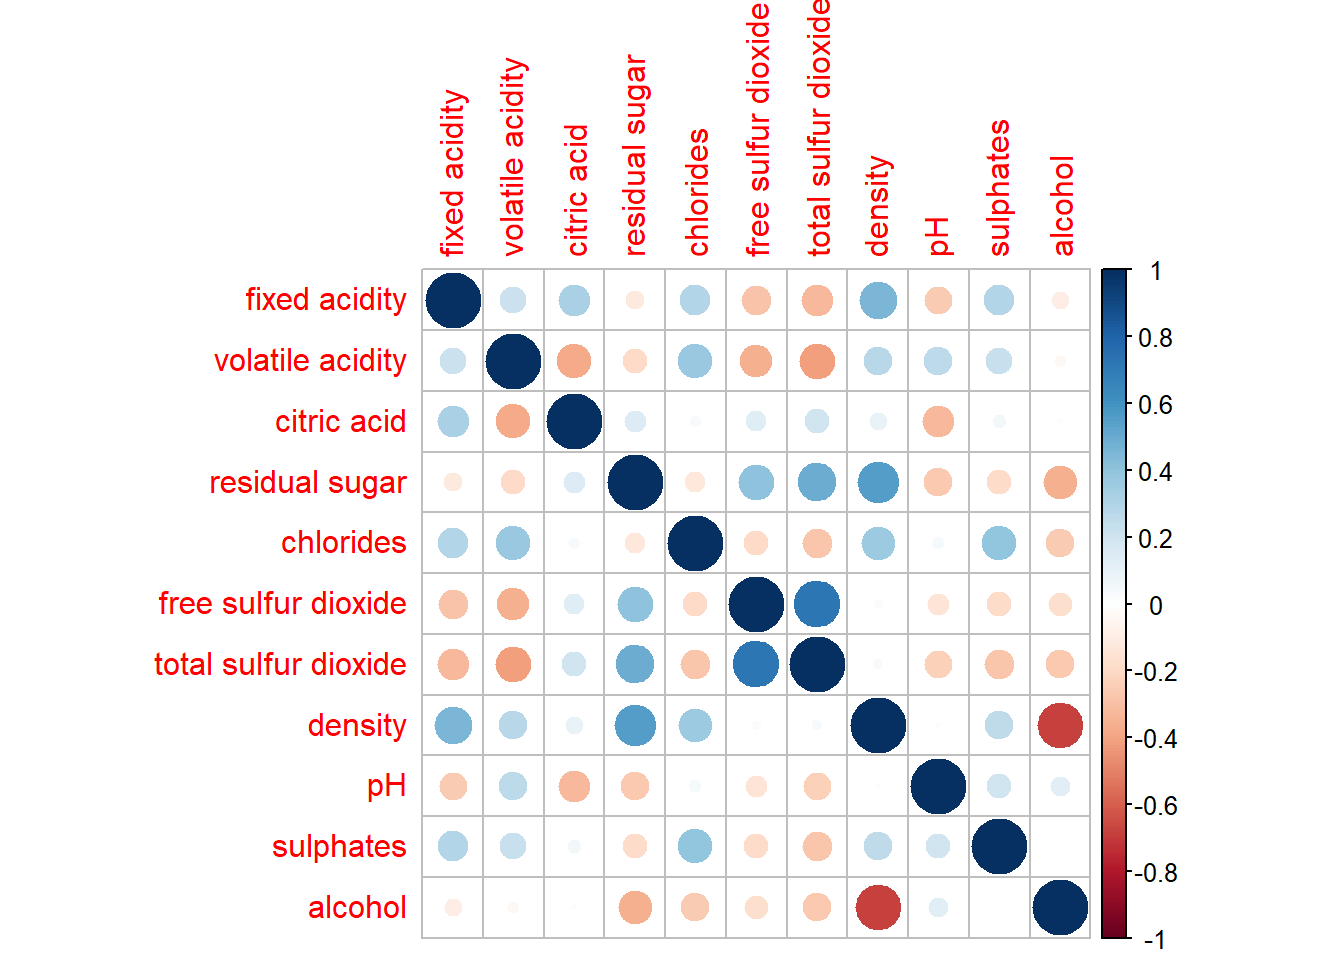
corrplot(wine.cor, method = "ellipse") 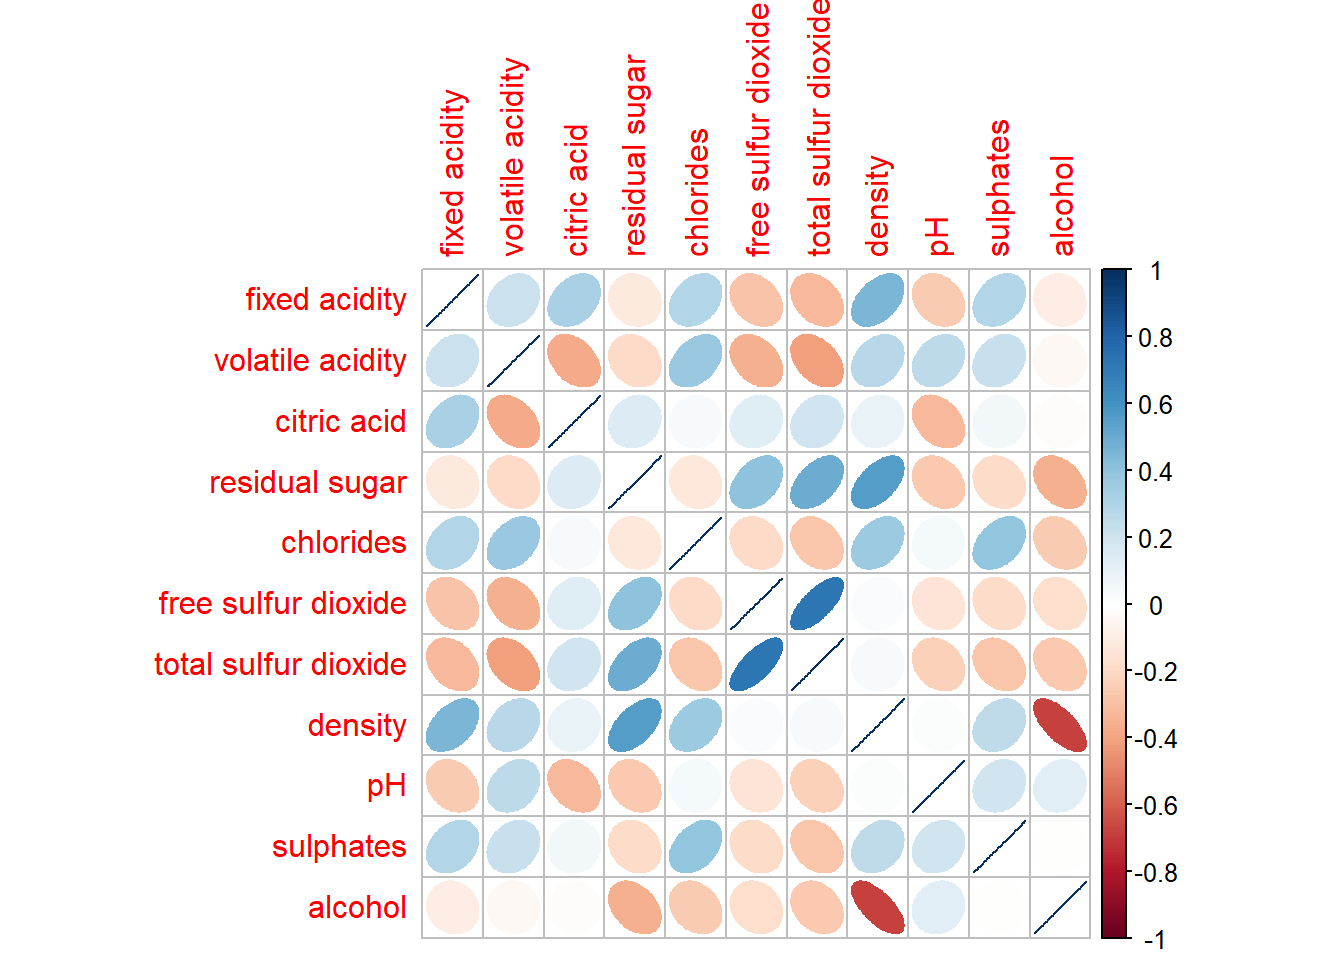
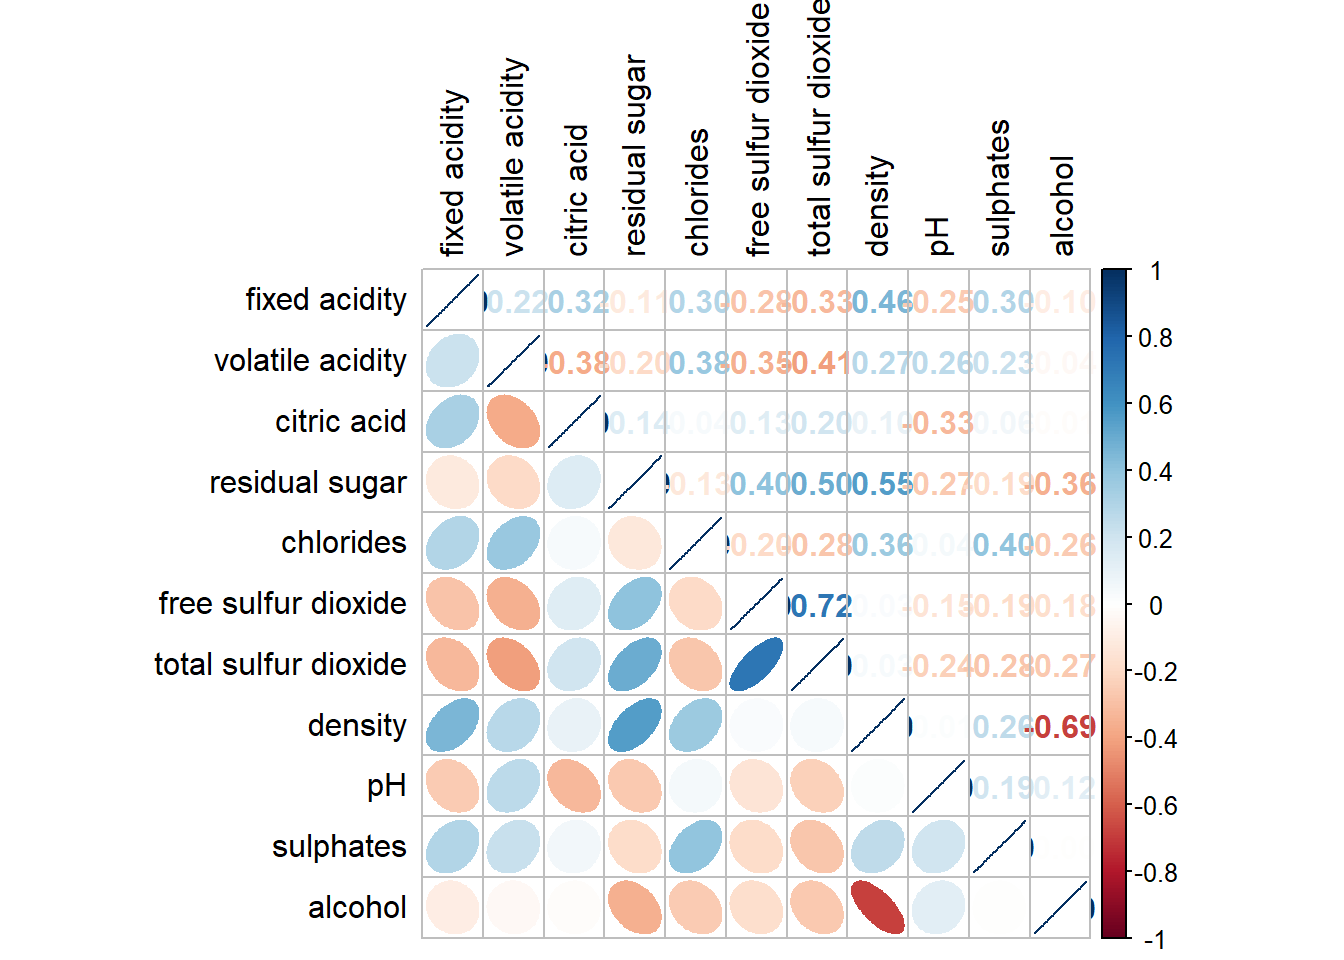
Working with mixed layout
corrplot.mixed(wine.cor,
               lower = "ellipse",
               upper = "number",
               tl.pos = "lt",
               diag = "l",
               tl.col = "black")